iSportConnect Sponsorship Index: Food & Beverage far more dominant among Rugby World Cup Teams sponsors
August 23, 2023
With the 2023 Rugby World Cup kicking off in just over two weeks in Paris, we decided it was time to take a deep dive into the teams sponsors with this month’s Sponsorship Index powered by caytoo.
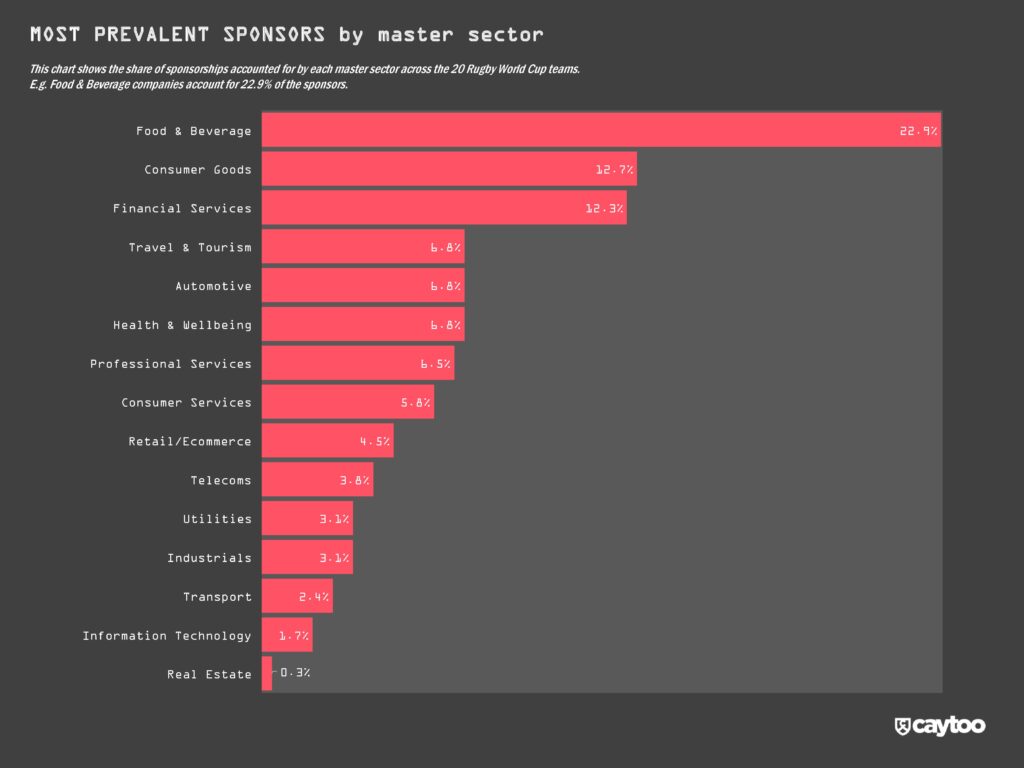
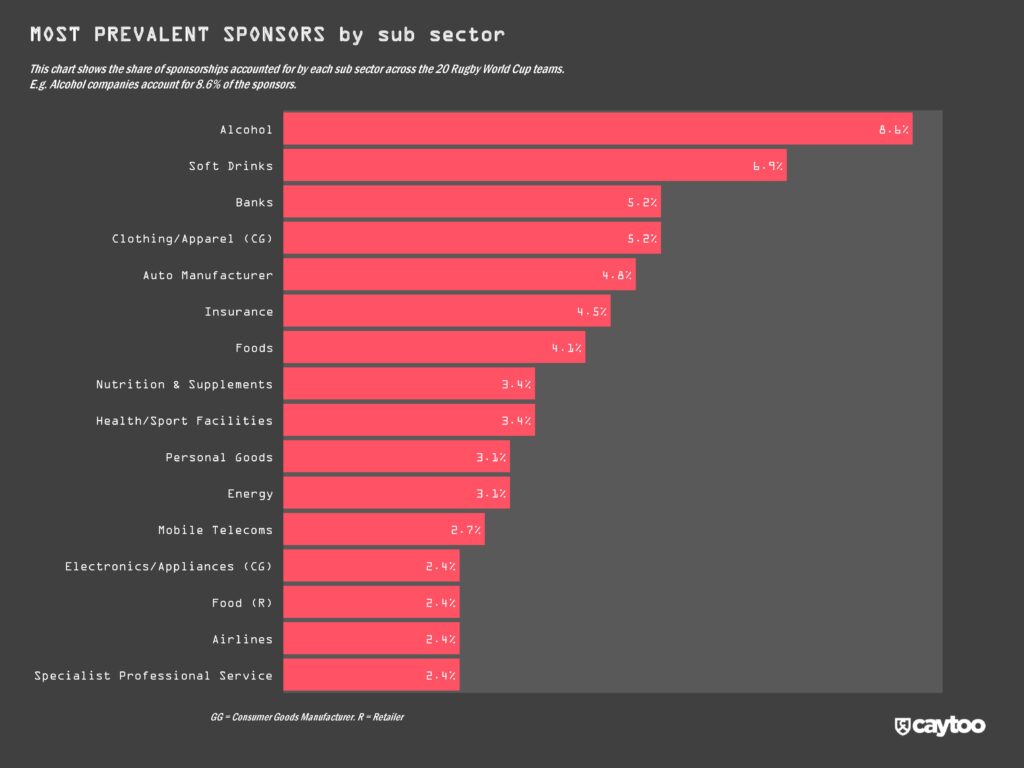
caytoo analysed the 291 sponsors of the 20 teams competing in the 2023 Rugby World Cup to identify the most prevalent sectors at a master (e.g. Food & Beverage) and sub-sector (e.g. Alcohol) level.
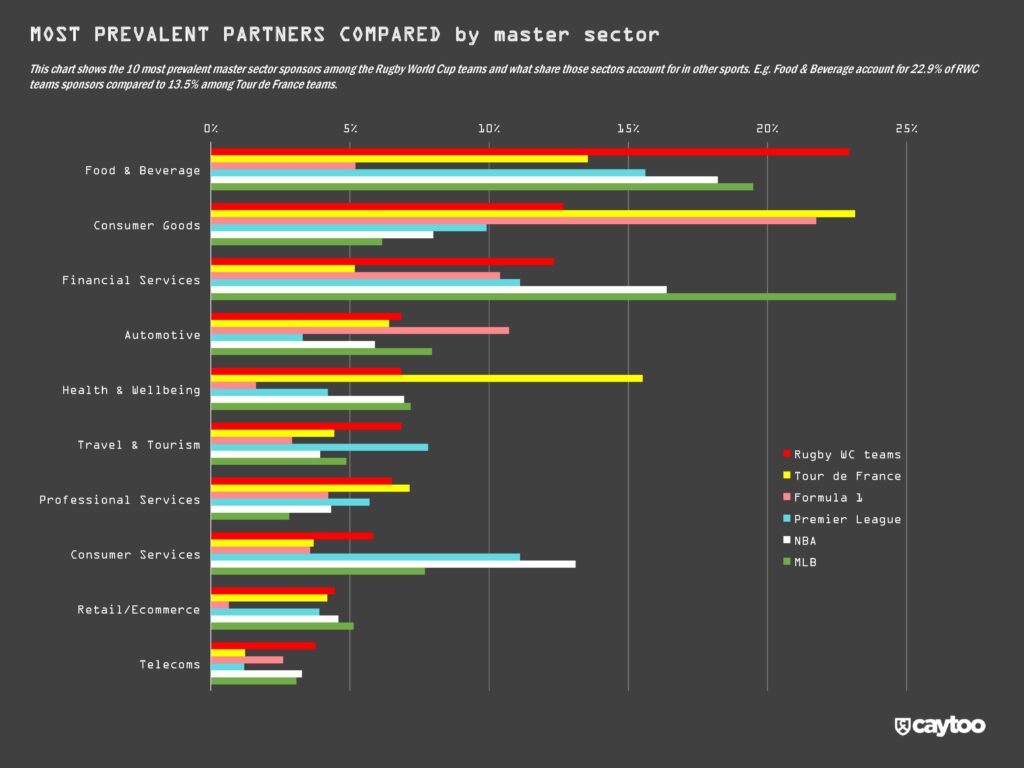
Food & Beverage is by far the most prevalent sector, accounting for 22.9% of teams’ sponsors, making the sector far more dominant than in other sports such as Formula 1 (5.2% share of sponsors), Tour de France teams (13.5%) and English football’s Premier League (15.6%). Only in the NBA (18.2%) and MLB (19.5%) does F&B’s prevalence come close to that of the Rugby World Cup teams.
F&B’s dominance is driven by Alcohol (8.6%) and Soft Drinks (6.9%) – the two most popular sub sectors – with beer accounting for nearly two-thirds of alcohol sponsors. For example, Guinness is the joint second most prevalent sponsor at four teams (along with Vodafone but one behind personal goods brand Dove at five). Alcohol is again far more dominant among the RWC teams than in F1, the Tour de France and EPL but less so than in the NBA (10.0%) and MLB (9.5%).
Consumer Goods (12.7% share) follows F&B as the second most prevalent sector, narrowly ahead of Financial Services (12.3%). Consumer Goods is driven by Clothing/Apparel manufacturers (the joint-third most prevalent sub sector at 5.2%), Personal Goods brands and Electronics/Appliances manufacturers while Financial Services is driven by Banks (the joint-third most prevalent sub sector at 5.2%) and Insurance firms.
It’s interesting that while Financial Services has a greater share in rugby than the other European-focused sports (cycling, F1 and soccer) it is much less prevalent than compared to the US-based MLB (24.6%) and NBA (16.4%).
Alongside F&B, other sectors that tend to ‘over-index’ on rugby compared to the other five sports covered (i.e. their share in rugby is higher than that across the other five) include Travel & Tourism (led by Airlines), Professional Services, Utilities (led by Energy firms) & Telecoms (led by Mobile Telecoms). Albeit none of these sectors make up a huge share in rugby – each accounting for between 3-7%.
In contrast, rugby WC teams tend to ‘under-index’ when it comes to attracting Information Technology sponsors, which is surprising given the sport has always had a strong following among the corporate crowd or business-decision-makers. For instance, IT accounts for just 1.7% of RWC teams sponsors compared to 21.8% in F1, 9.6% in the EPL, 5.5% in the NBA, 3.8% in the MLB and 3.2% among Tour de France teams.
This could be down to the World Cup audience having a higher concentration of the general public / consumers than the sport’s more regular week-in, week-out fans.
Another sector in which the rugby WC teams under-index compared to the European-based sports is the Industrials sector which comprises Construction, Engineering/Manufacturing and Materials/Chemicals firms. They account for just 3.1% of sponsors compared to 10.1% in F1, 5.7% in the Tour de France and 4.8% in the EPL. Although this is higher than in the US-based MLB (1.8%) and NBA (2.0%).


